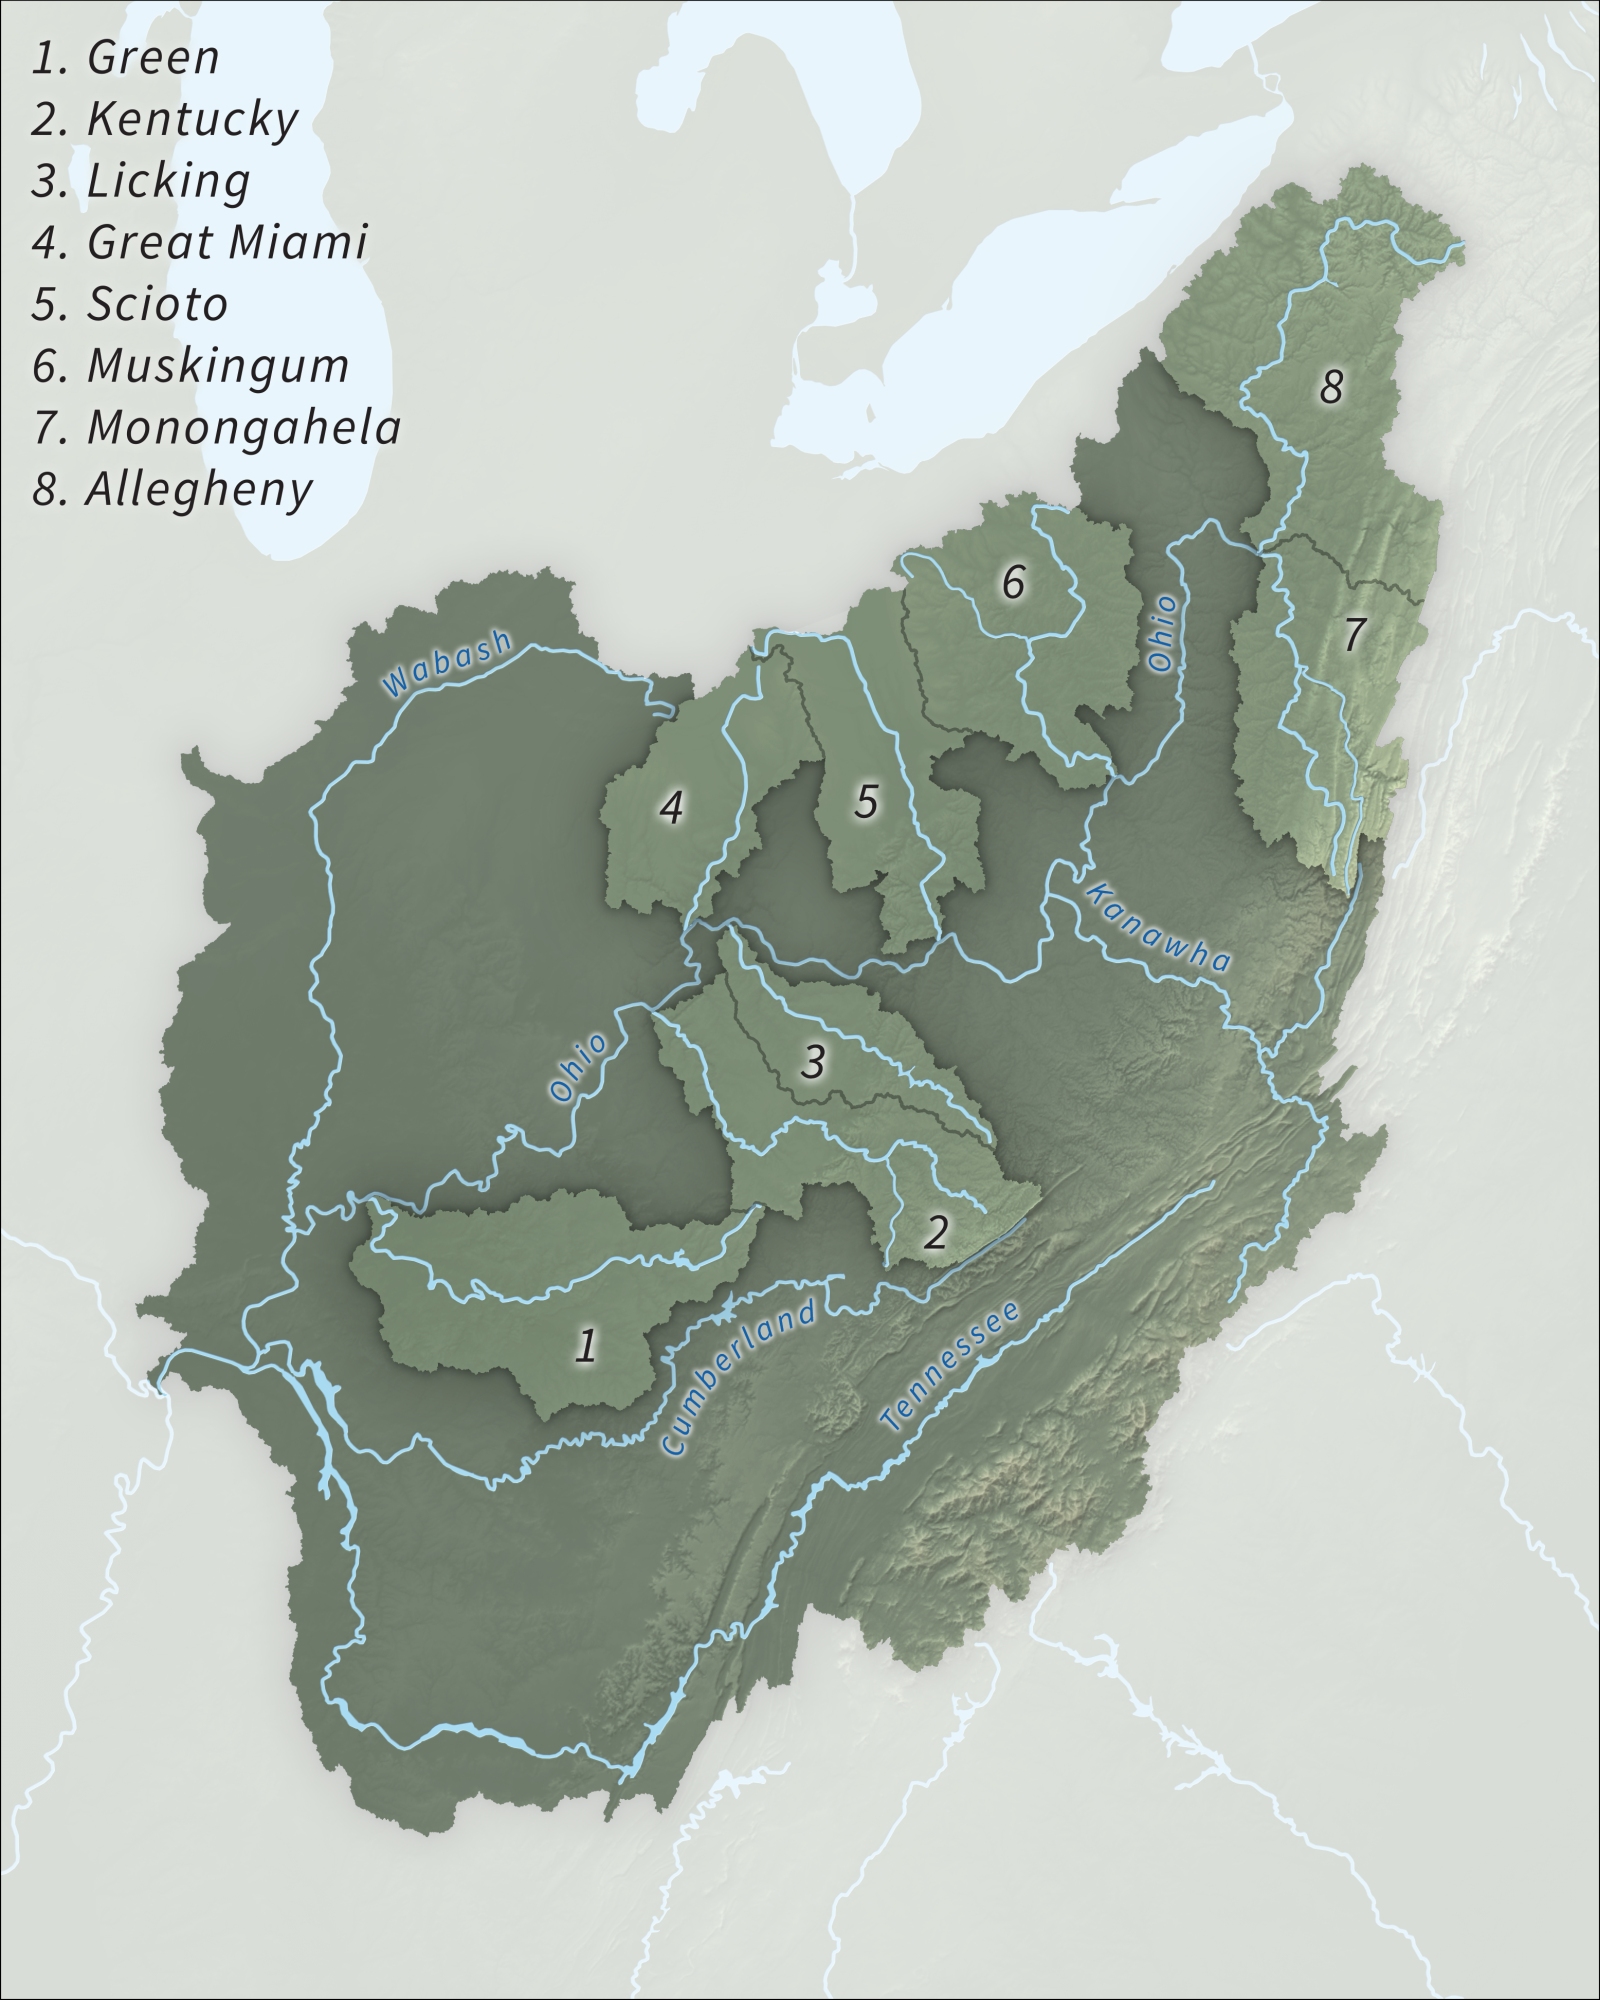
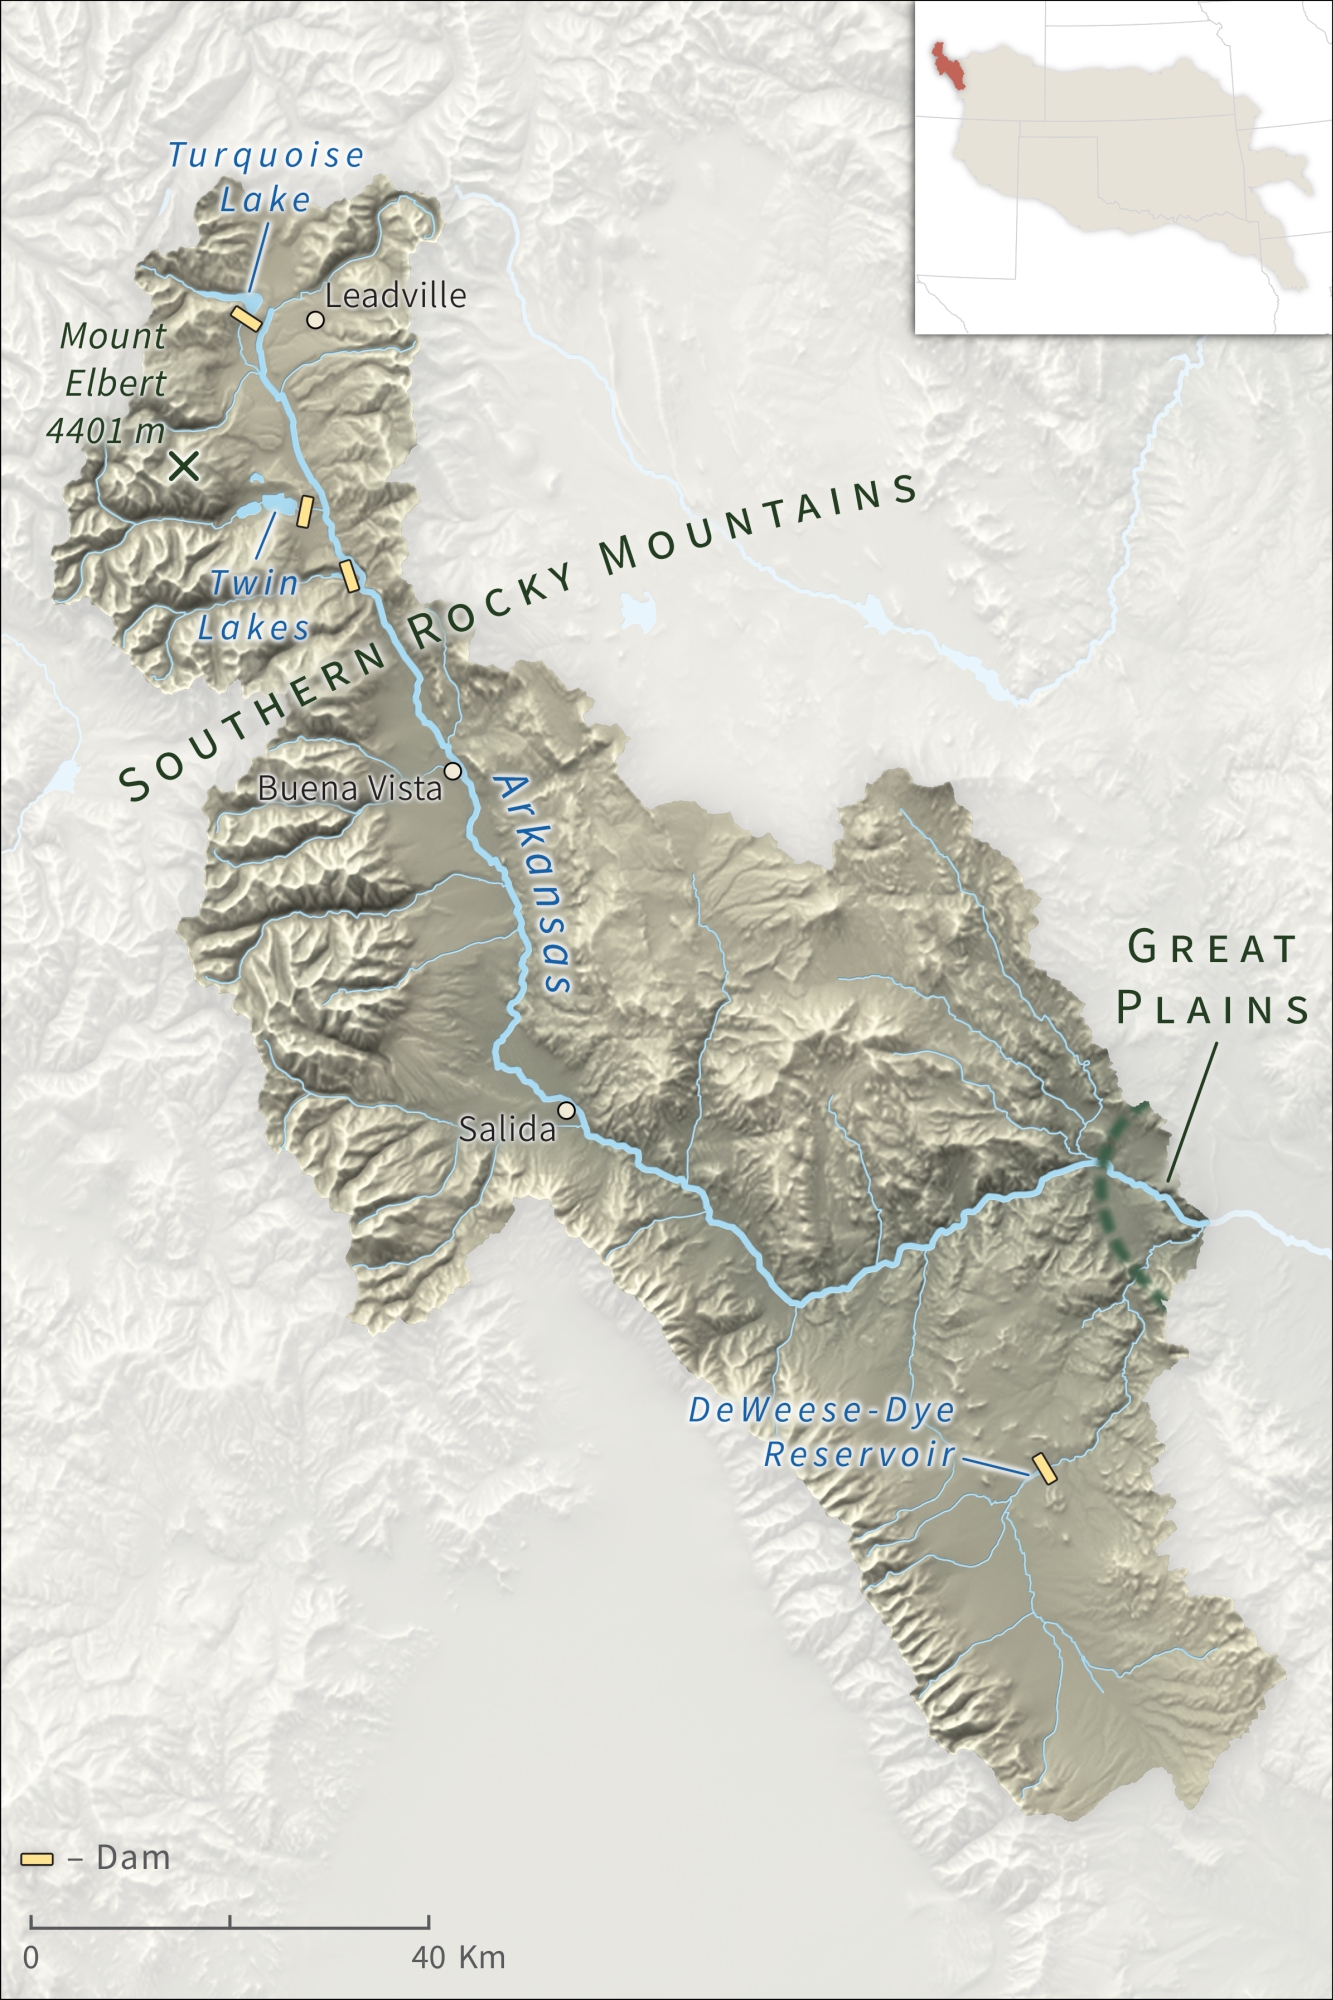
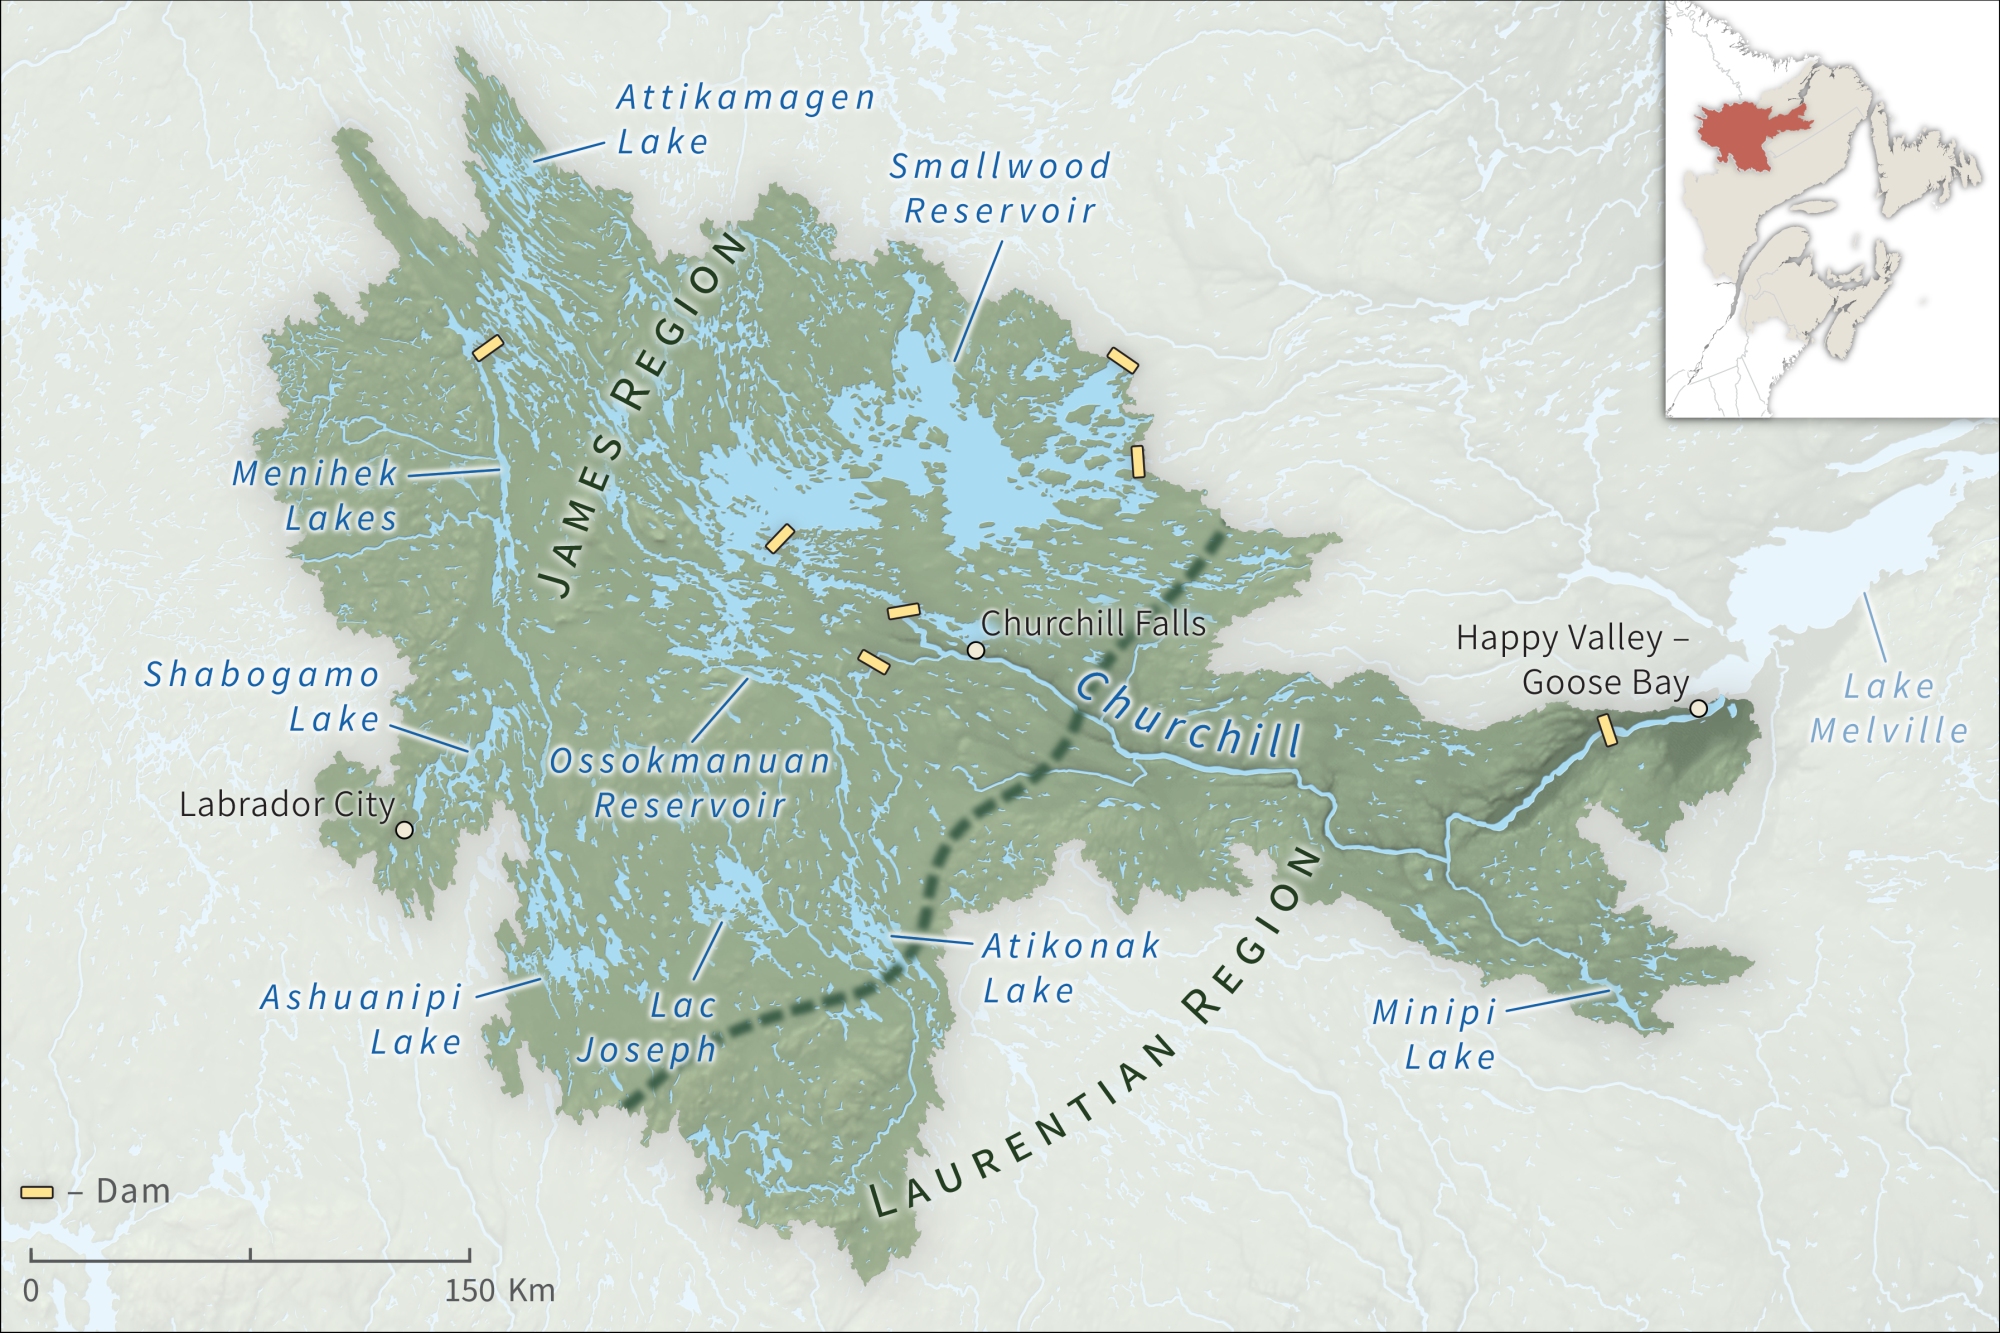
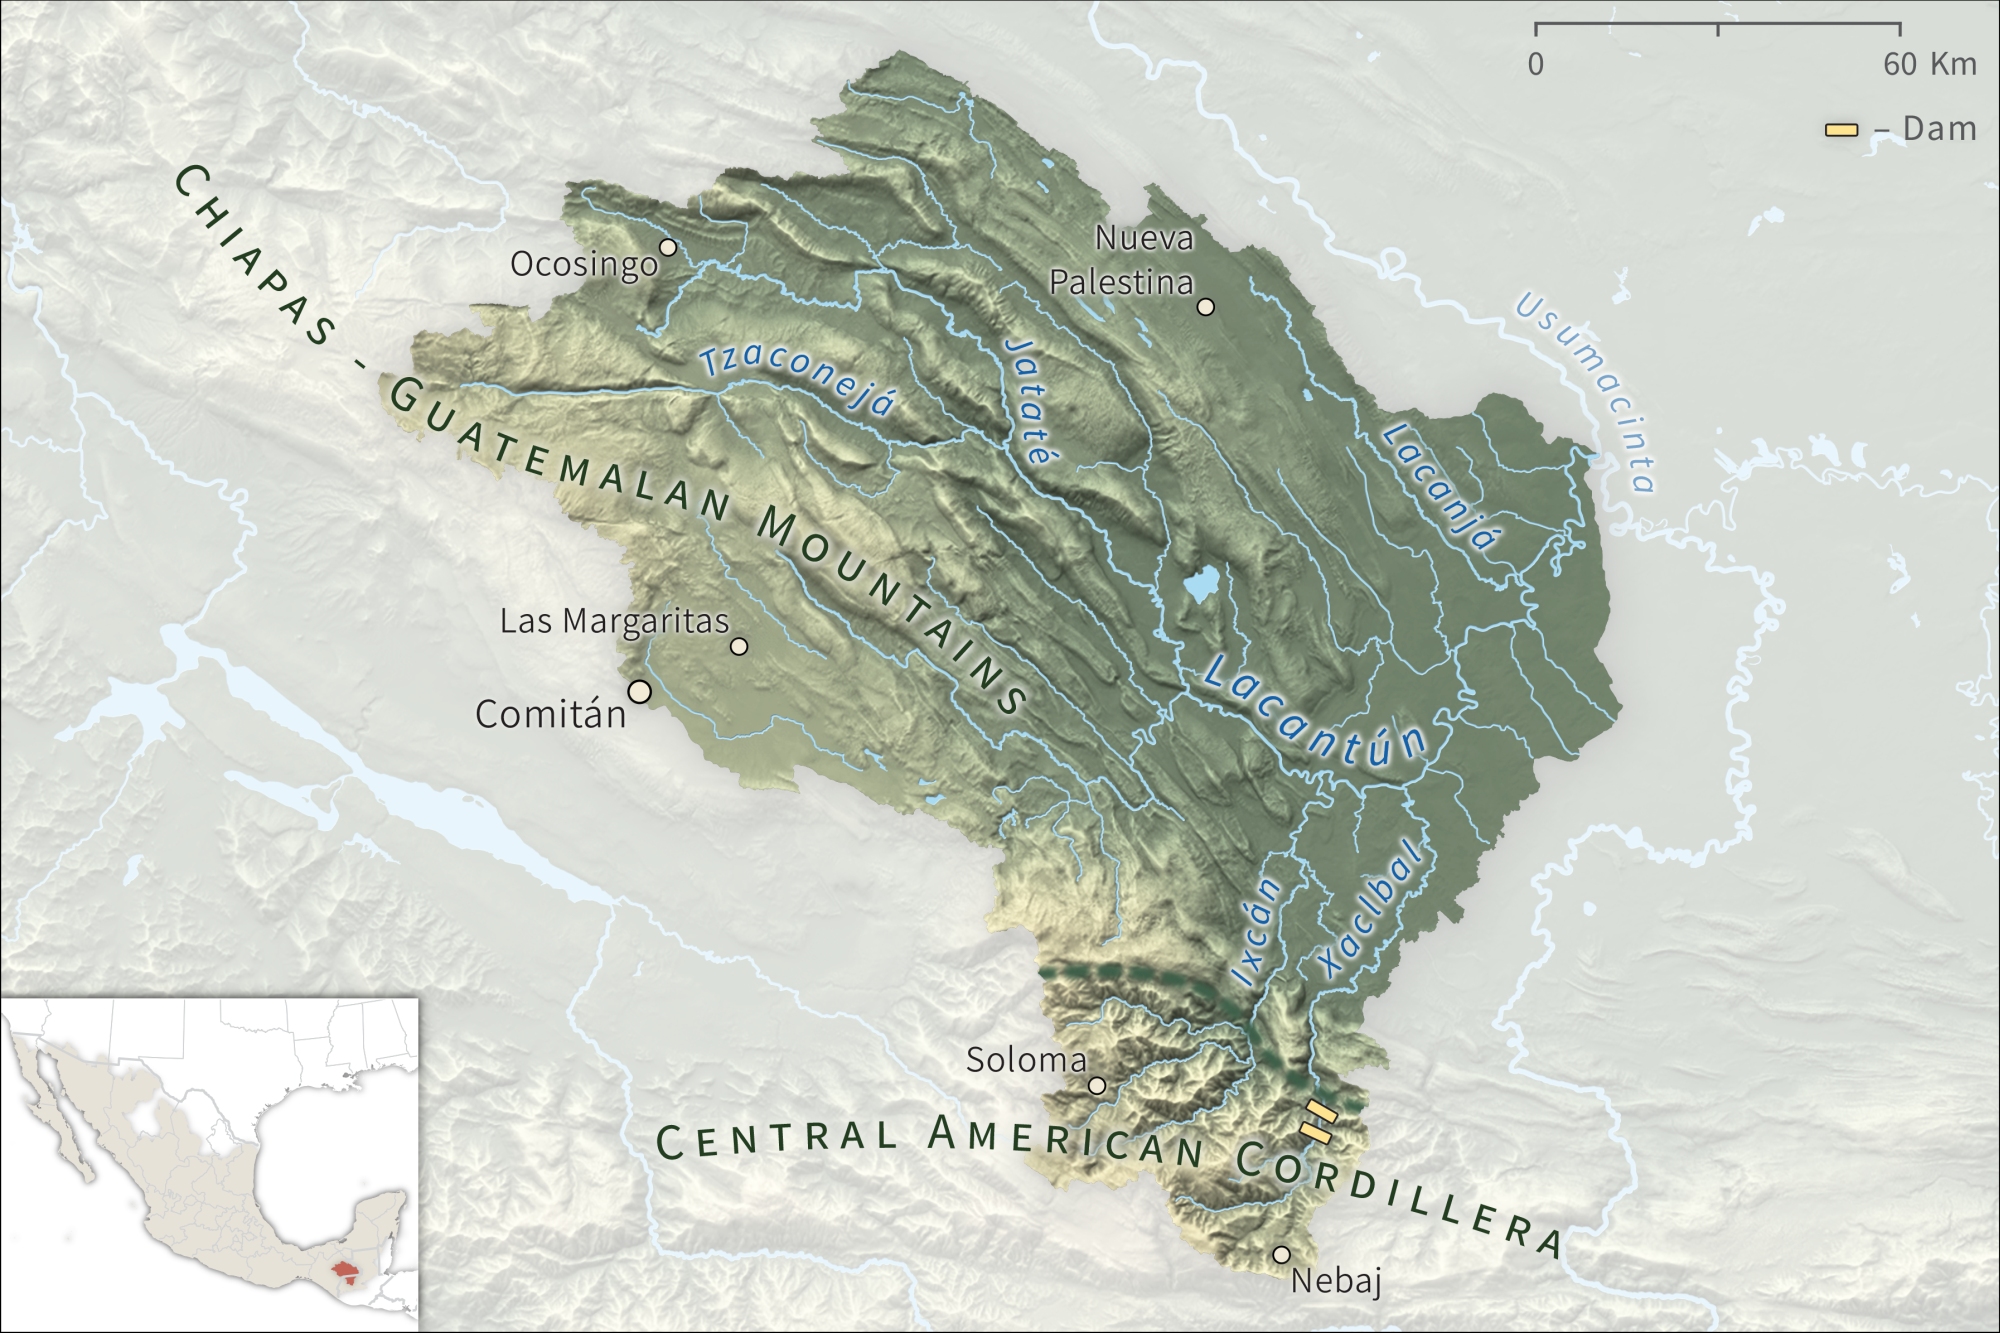
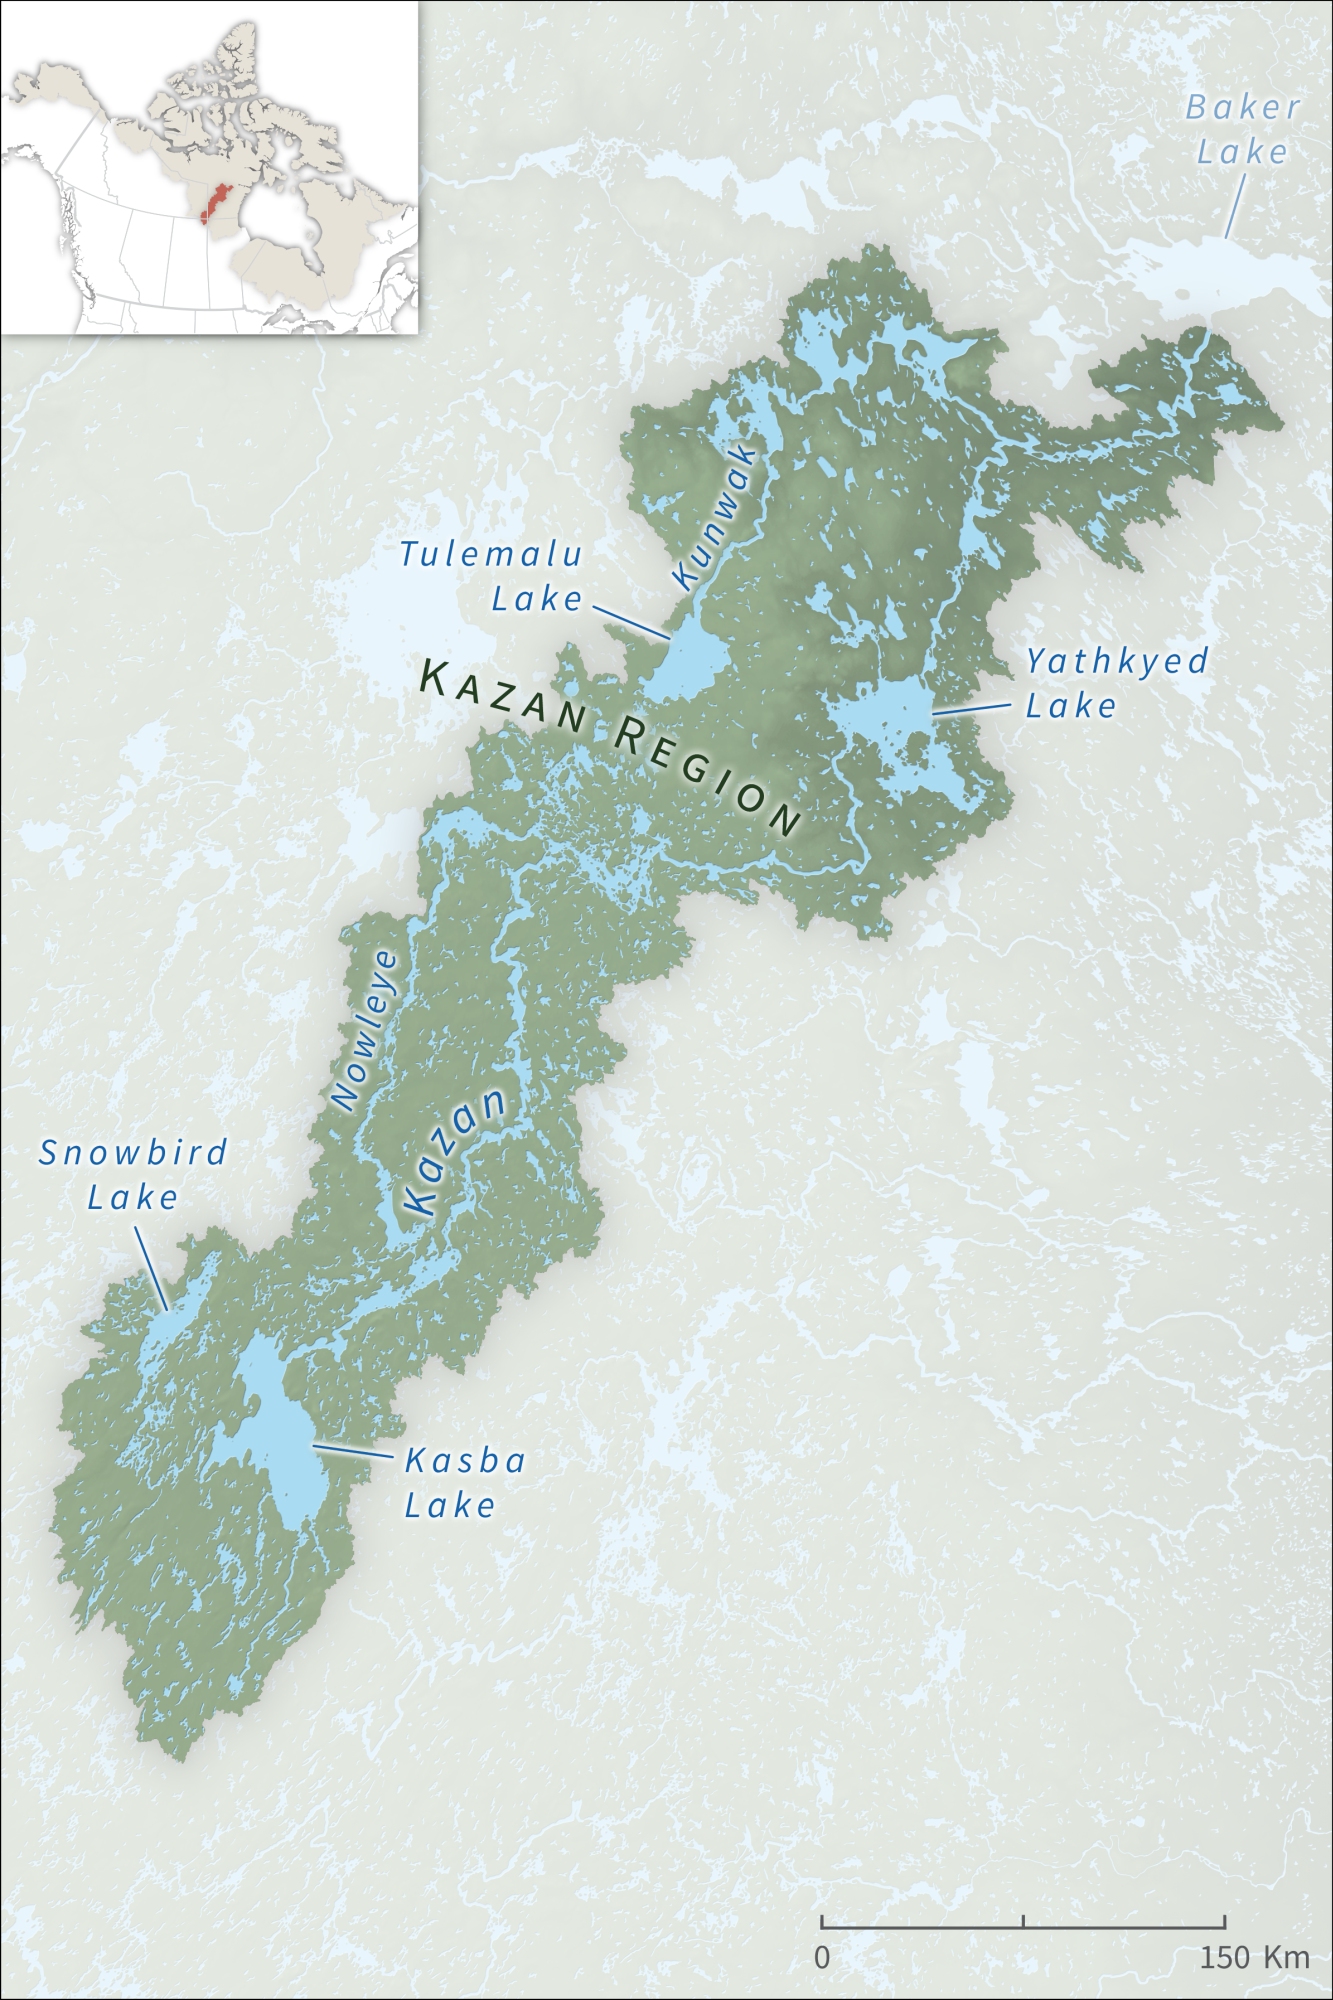
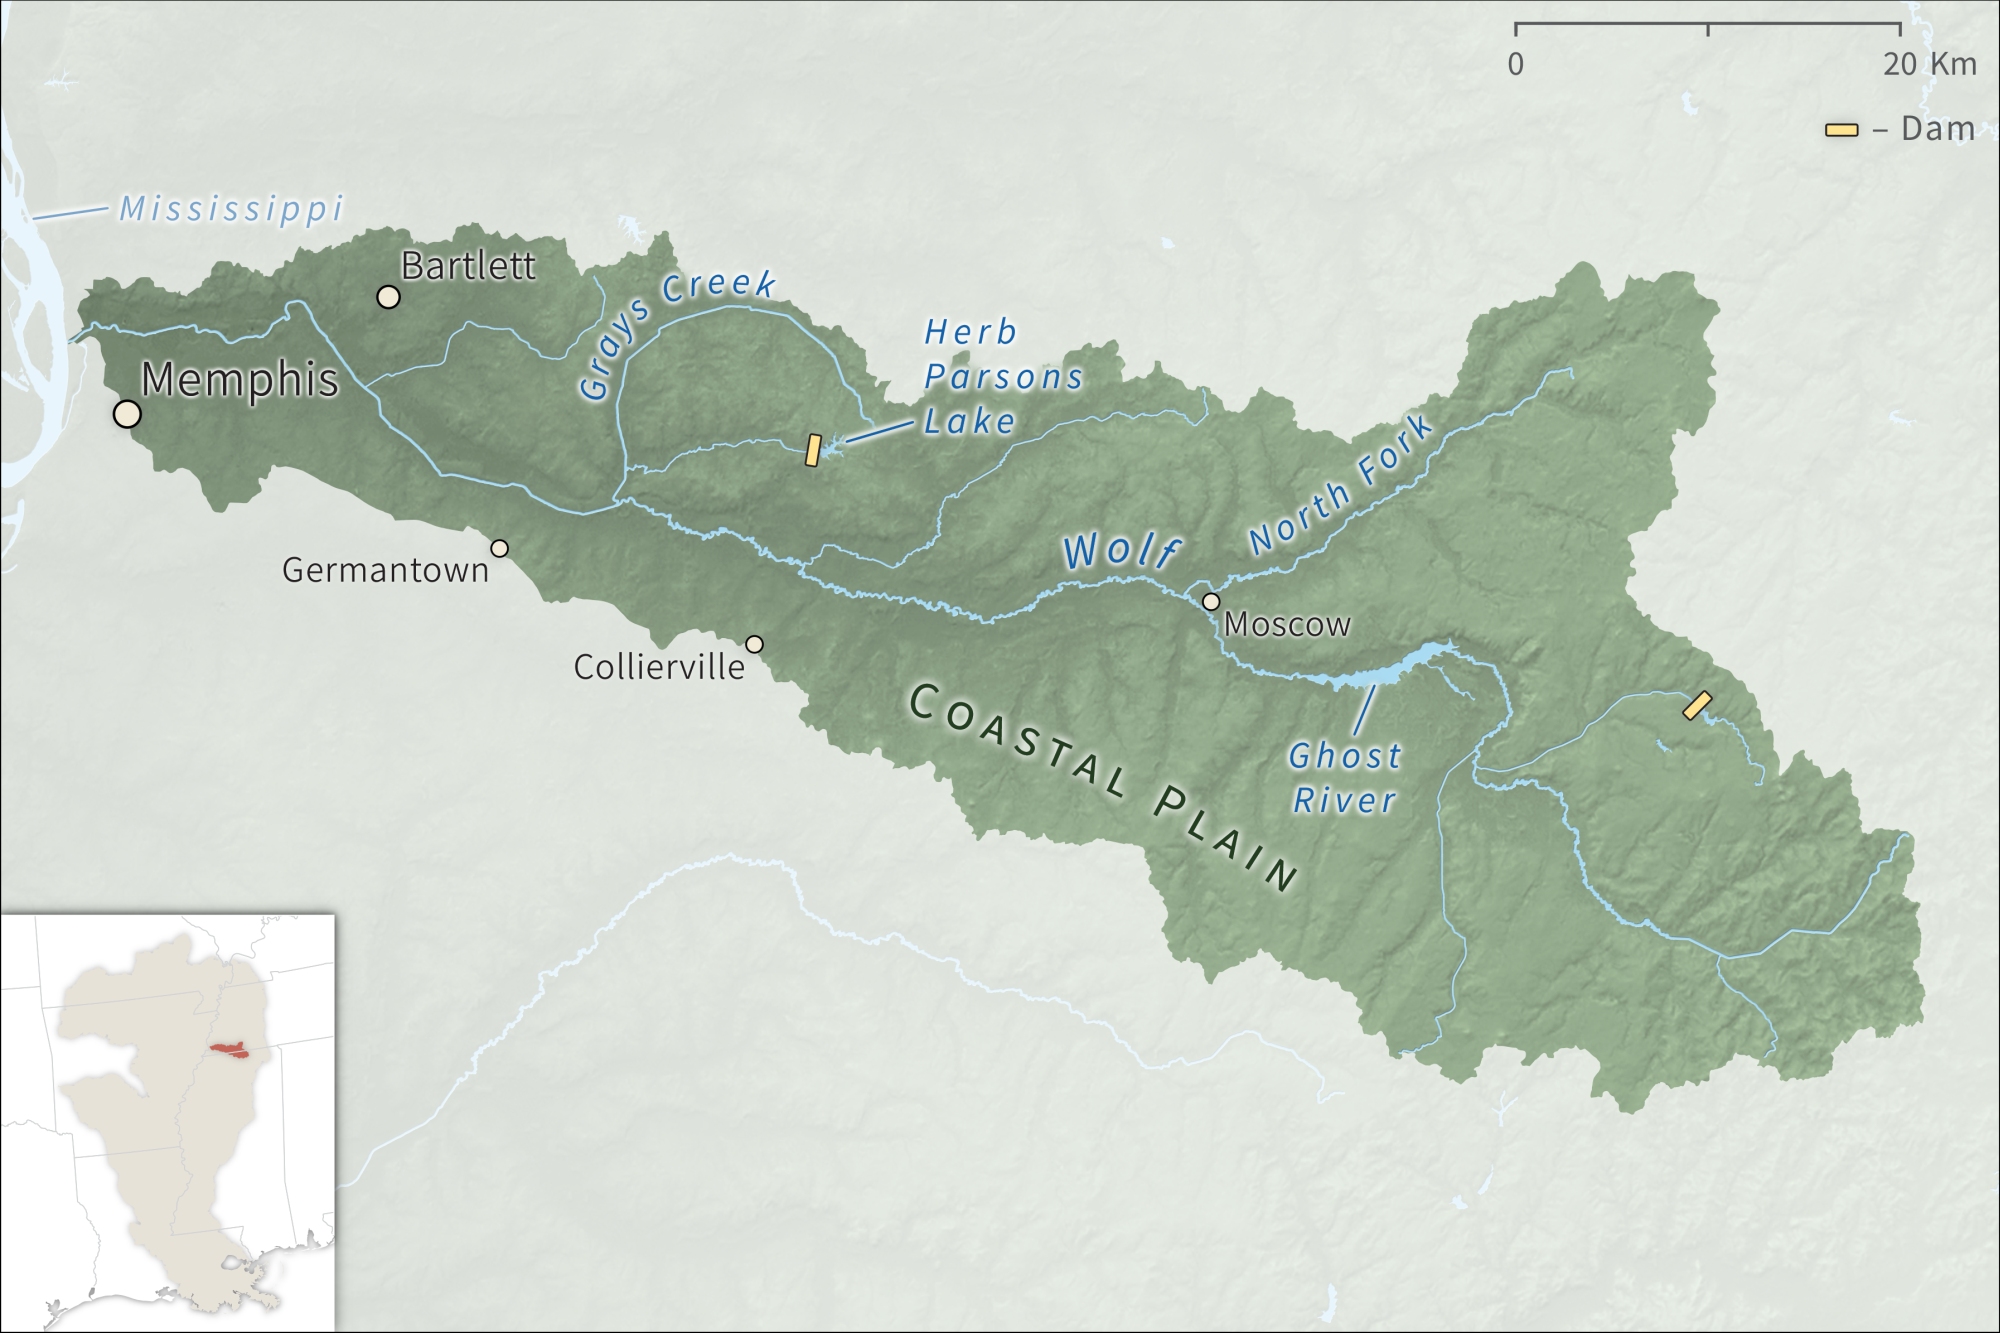
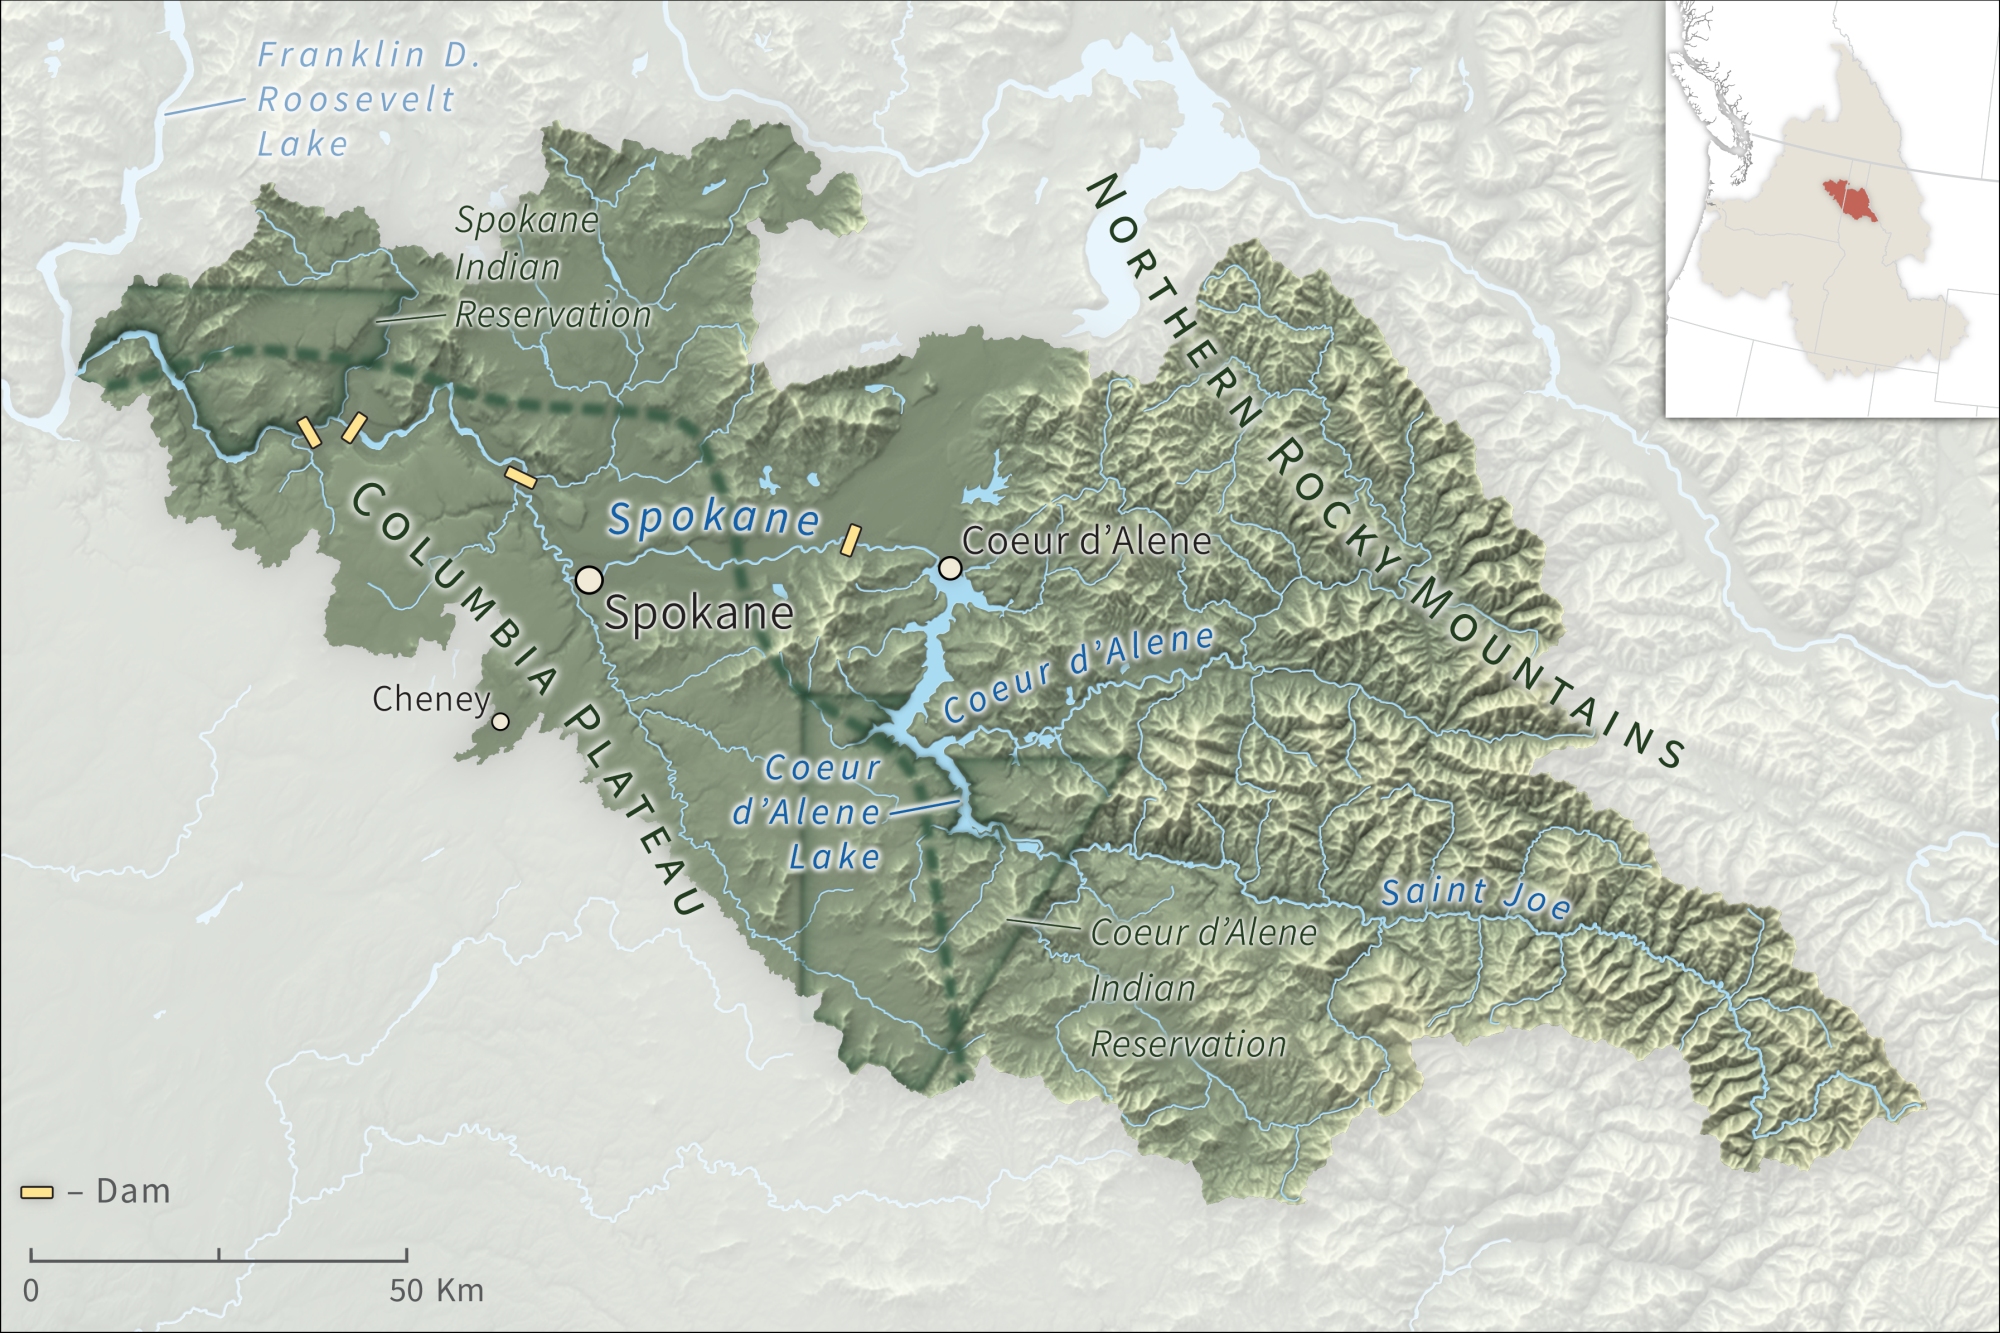
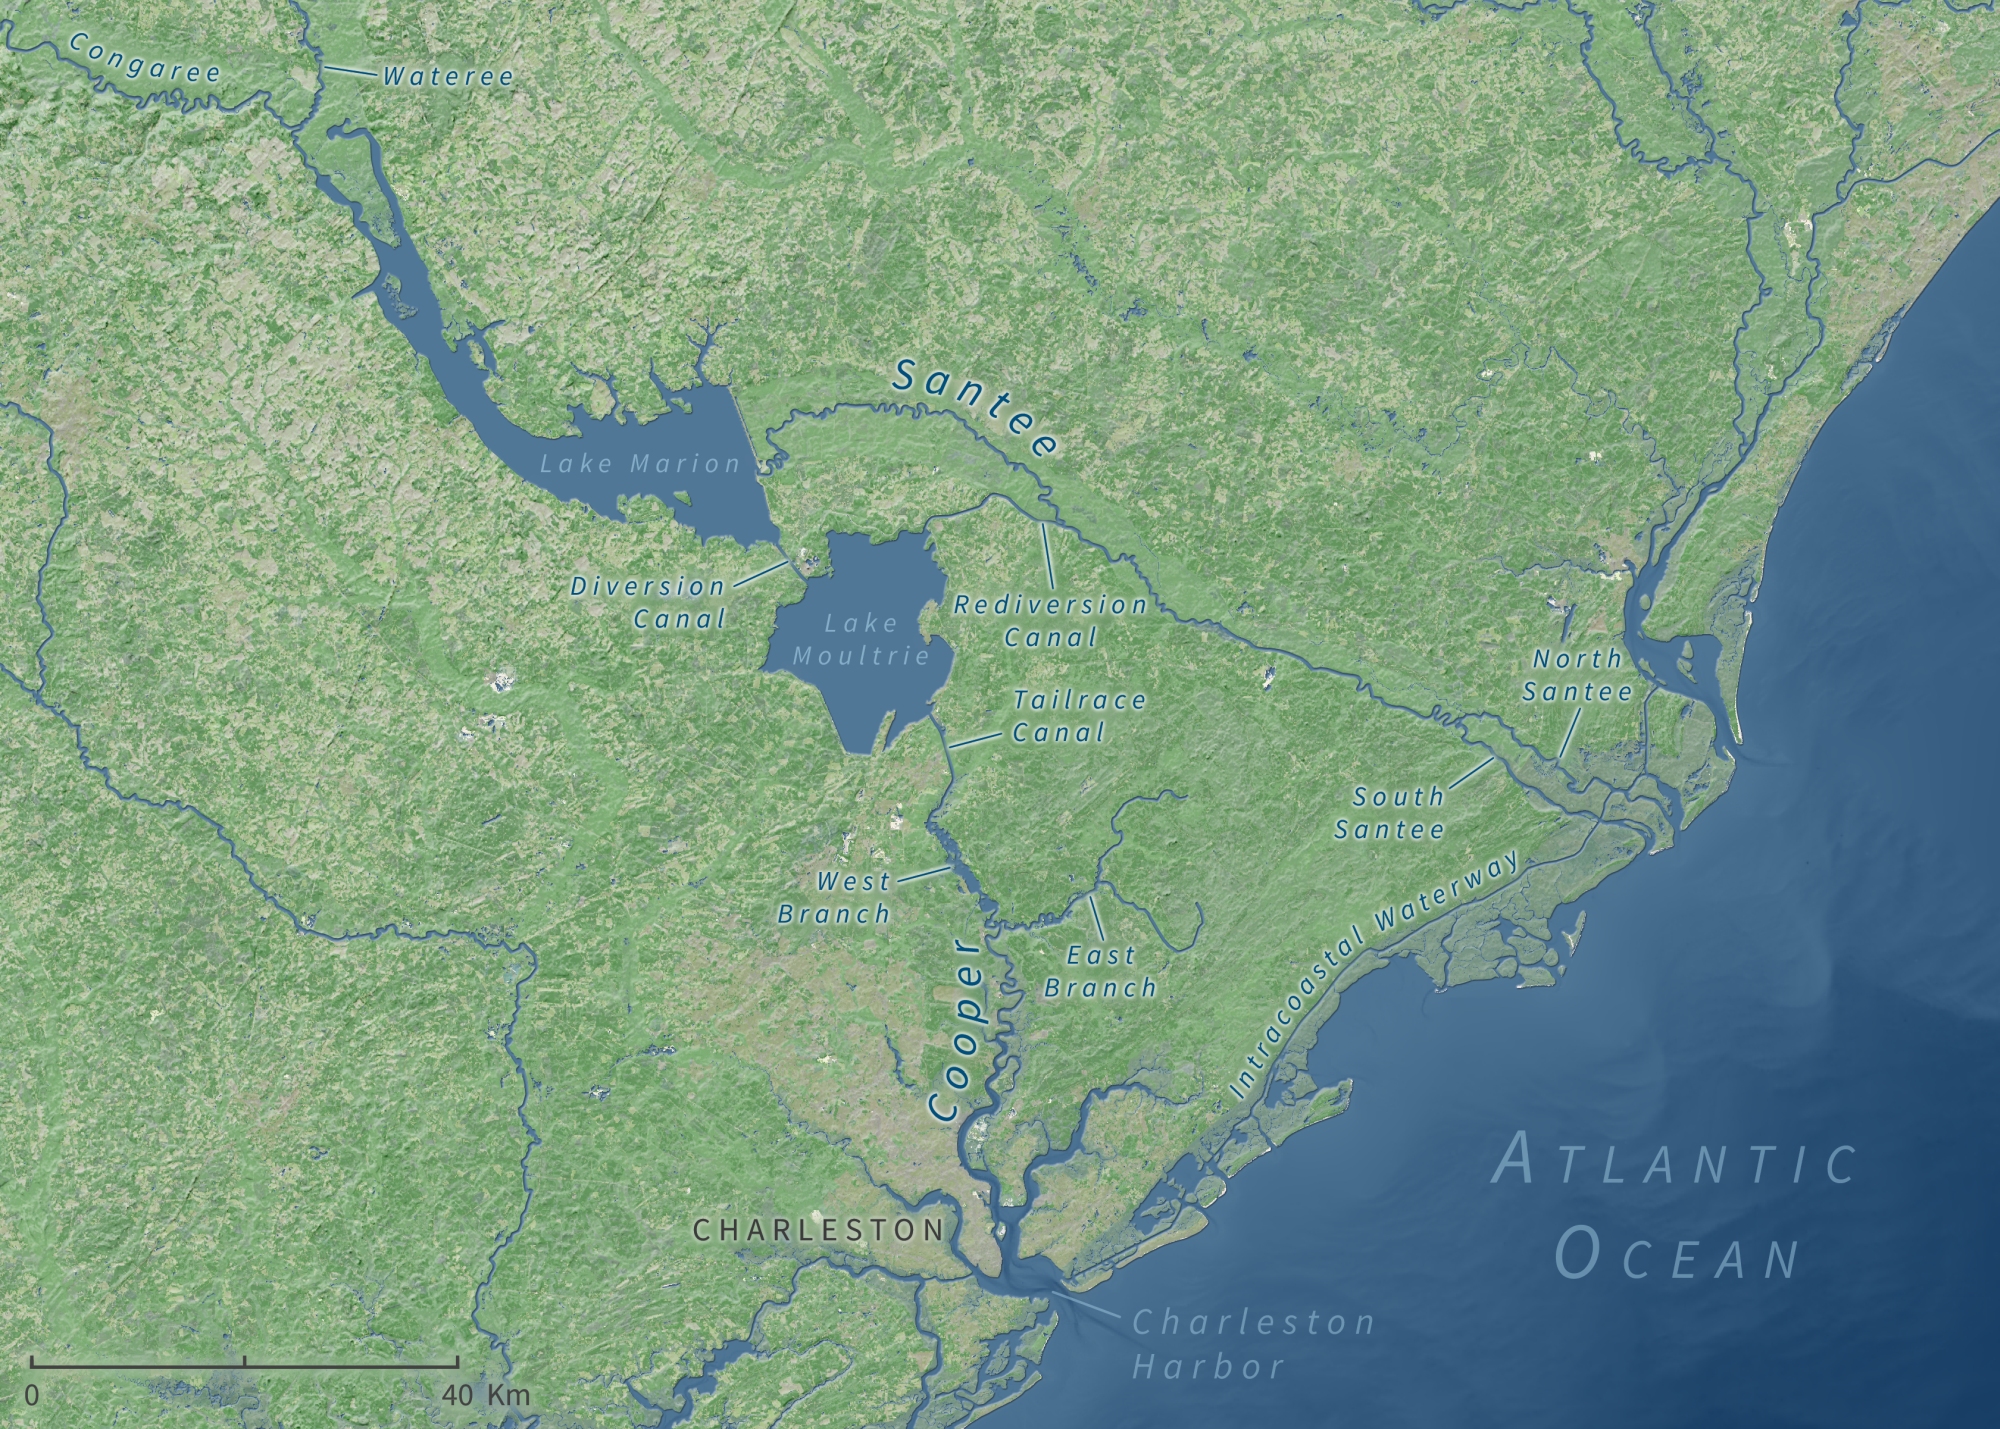
Rivers of North America
My last major project at UA's Cartographic Research was working on the maps for the second edition of Rivers of North America, a massive reference book that provides in-depth examinations of river systems across North America. Since each map covers individual watersheds that vary significantly in all aspects from physical size to topographic character, from the outset it became clear to me that this project would require that I make deliberate choices concerning everything from data selection to cartographic stylizing to ensure that the mapmaking process could be streamlined as much as possible.
Given the geographic scope of this job, coming across all of the data needed to make maps spanning from Ellesmere Island to Central America was no easy task. All told, the maps as a whole call for data on rivers and streams; lakes and other bodies of water; elevation; major urban settlements; dams; and even the physiographic divisions of North America. The majority of maps are produced using vector data from the Global Map initiative and GMTED2010 raster elevation data, since these data sources are relatively seamless across national boundaries and are flexible enough to accomodate the mapping of most watersheds featured in the book (though some smaller watersheds must be mapped using even larger scale data). Watershed data, meanwhile, was largely acquired from national and state/provincial repositories in which the watersheds can be found, although for many cases (particularly in the Canadian Arctic and in Central America), it was necessary to manually delineate the watershed boundaries where no reliable data otherwise existed, which was done in QGIS using the hydrological tools found in the excellent (and free!) Whitebox Tools. Furthermore, in order to maintain consistency among all of the maps, each linear stream network dataset was modified to take on the rank scale system utilized by the Natural Earth global rivers dataset, so that a consistent stream hierarchy could be established across all maps relatively quickly and effortlessly.
Each map is made using QGIS, Adobe Photoshop and Illustrator (including Avenza MAPublisher), Pyramid Shader, and Natural Scene Designer. The video at the top of this page showcases my talk at NACIS 2019's Practical Cartography Day, in which I broke down some of the steps that went into making the maps. I completed the project in May 2020, which ultimately came out to encompass more than 180 maps. A sample of these maps can be found below—I did my best to select sample maps that cover all parts of North America; it also includes an example of the overview map used at the beginning of each chapter, as well as a supplementary, larger-scale map made using a somewhat different style altogether.